In this blog post I will be going through how I went about building a Network Dashboard using couple of my favorite Python libraries, Nornir and Rich. I’m quite sure that if you have been exploring the network automation world, you would have come across Nornir already. And similarly there is a very good chance that you have also come across Rich, which is in my opinion one of the coolest libraries out there! If you are someone who loves working in CLI, like I do, you will absolutely love Rich!
Nornir is a pure python framework which makes use of Plugins to accomplish various tasks. As we go through this post you will see how these Plugins are super useful in getting things done and if you prefer to use a different plugin you can do so with minimal change. Like for instance, I will be using the Juniper PyEZ plugin to interact and fetch details from the routers, you can instead use Napalm, Netmiko, etc as per your convenience. The Inventory is the critical part of Nornir and it is mainly comprised of hosts, groups and config files in yaml format. For my script, I will be using a very basic version of Inventory, you can get really creative to make it very robust as per your needs.
(venv) sohanr@sohanr-mbp dashboard % tree
.
├── config.yaml
├── dashboard.py
├── groups.yaml
├── hosts.yaml
├── nornir.log
└── test.py

1 directory, 6 files
hosts.yaml
In hosts.yaml file we define details of hosts we will be working with in our script.
---
vMX1:
  hostname: vmx1.norn.lab
  port: 31003
  groups:
    - nos
vMX2:
  hostname: vmx2.norn.lab
  port: 31006
  groups:
    - nos
vMX3:
  hostname: vmx3.norn.lab
  port: 31009
  groups:
    - nos
groups.yaml
In groups.yaml file we define any group specific attributes, this can include any login information, platform information, etc
---
devices:
  username: username1
  password: Password1
nos:
  platform: junos
  groups:
    - devices
config.yaml
Everything comes together in a config.yaml file, where you can define pointers to your hosts and group files.
---
inventory:
    options:
        host_file: "hosts.yaml"
        group_file: "groups.yaml"
runner:
    options:
        num_workers: 10
End Goal
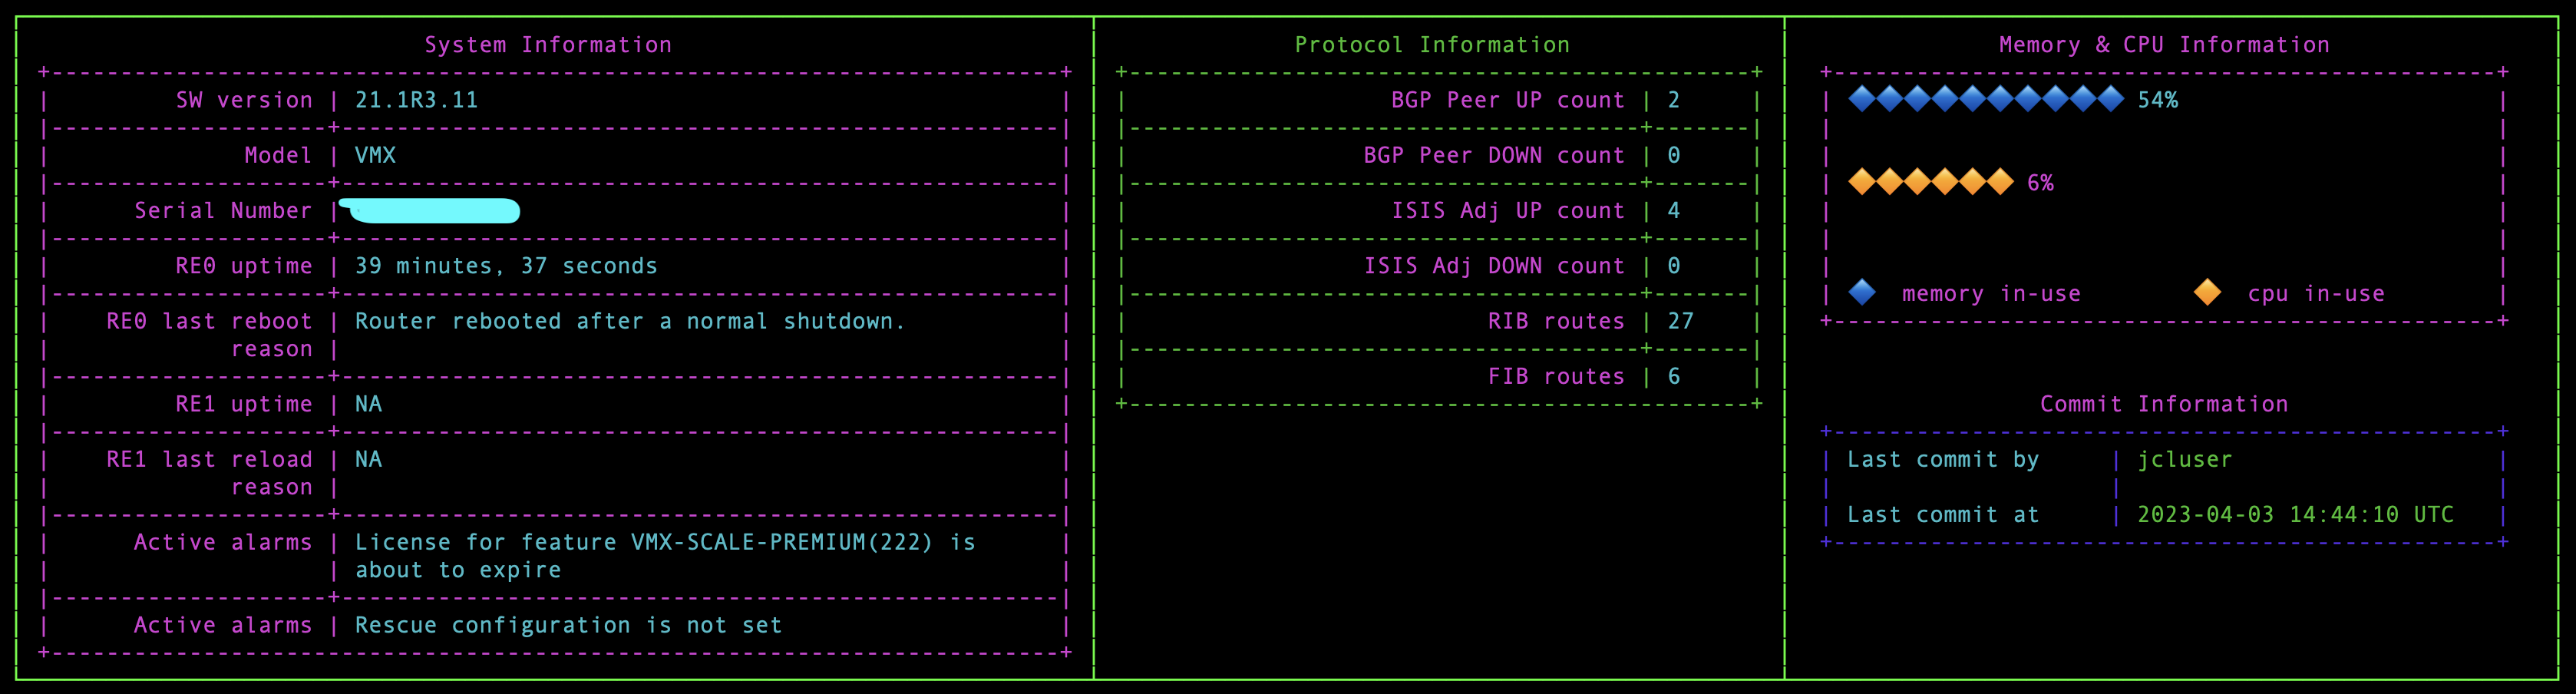
Before we dive into the script, let’s look at the end result so that we can then break things down to sections to tackle it one by one.
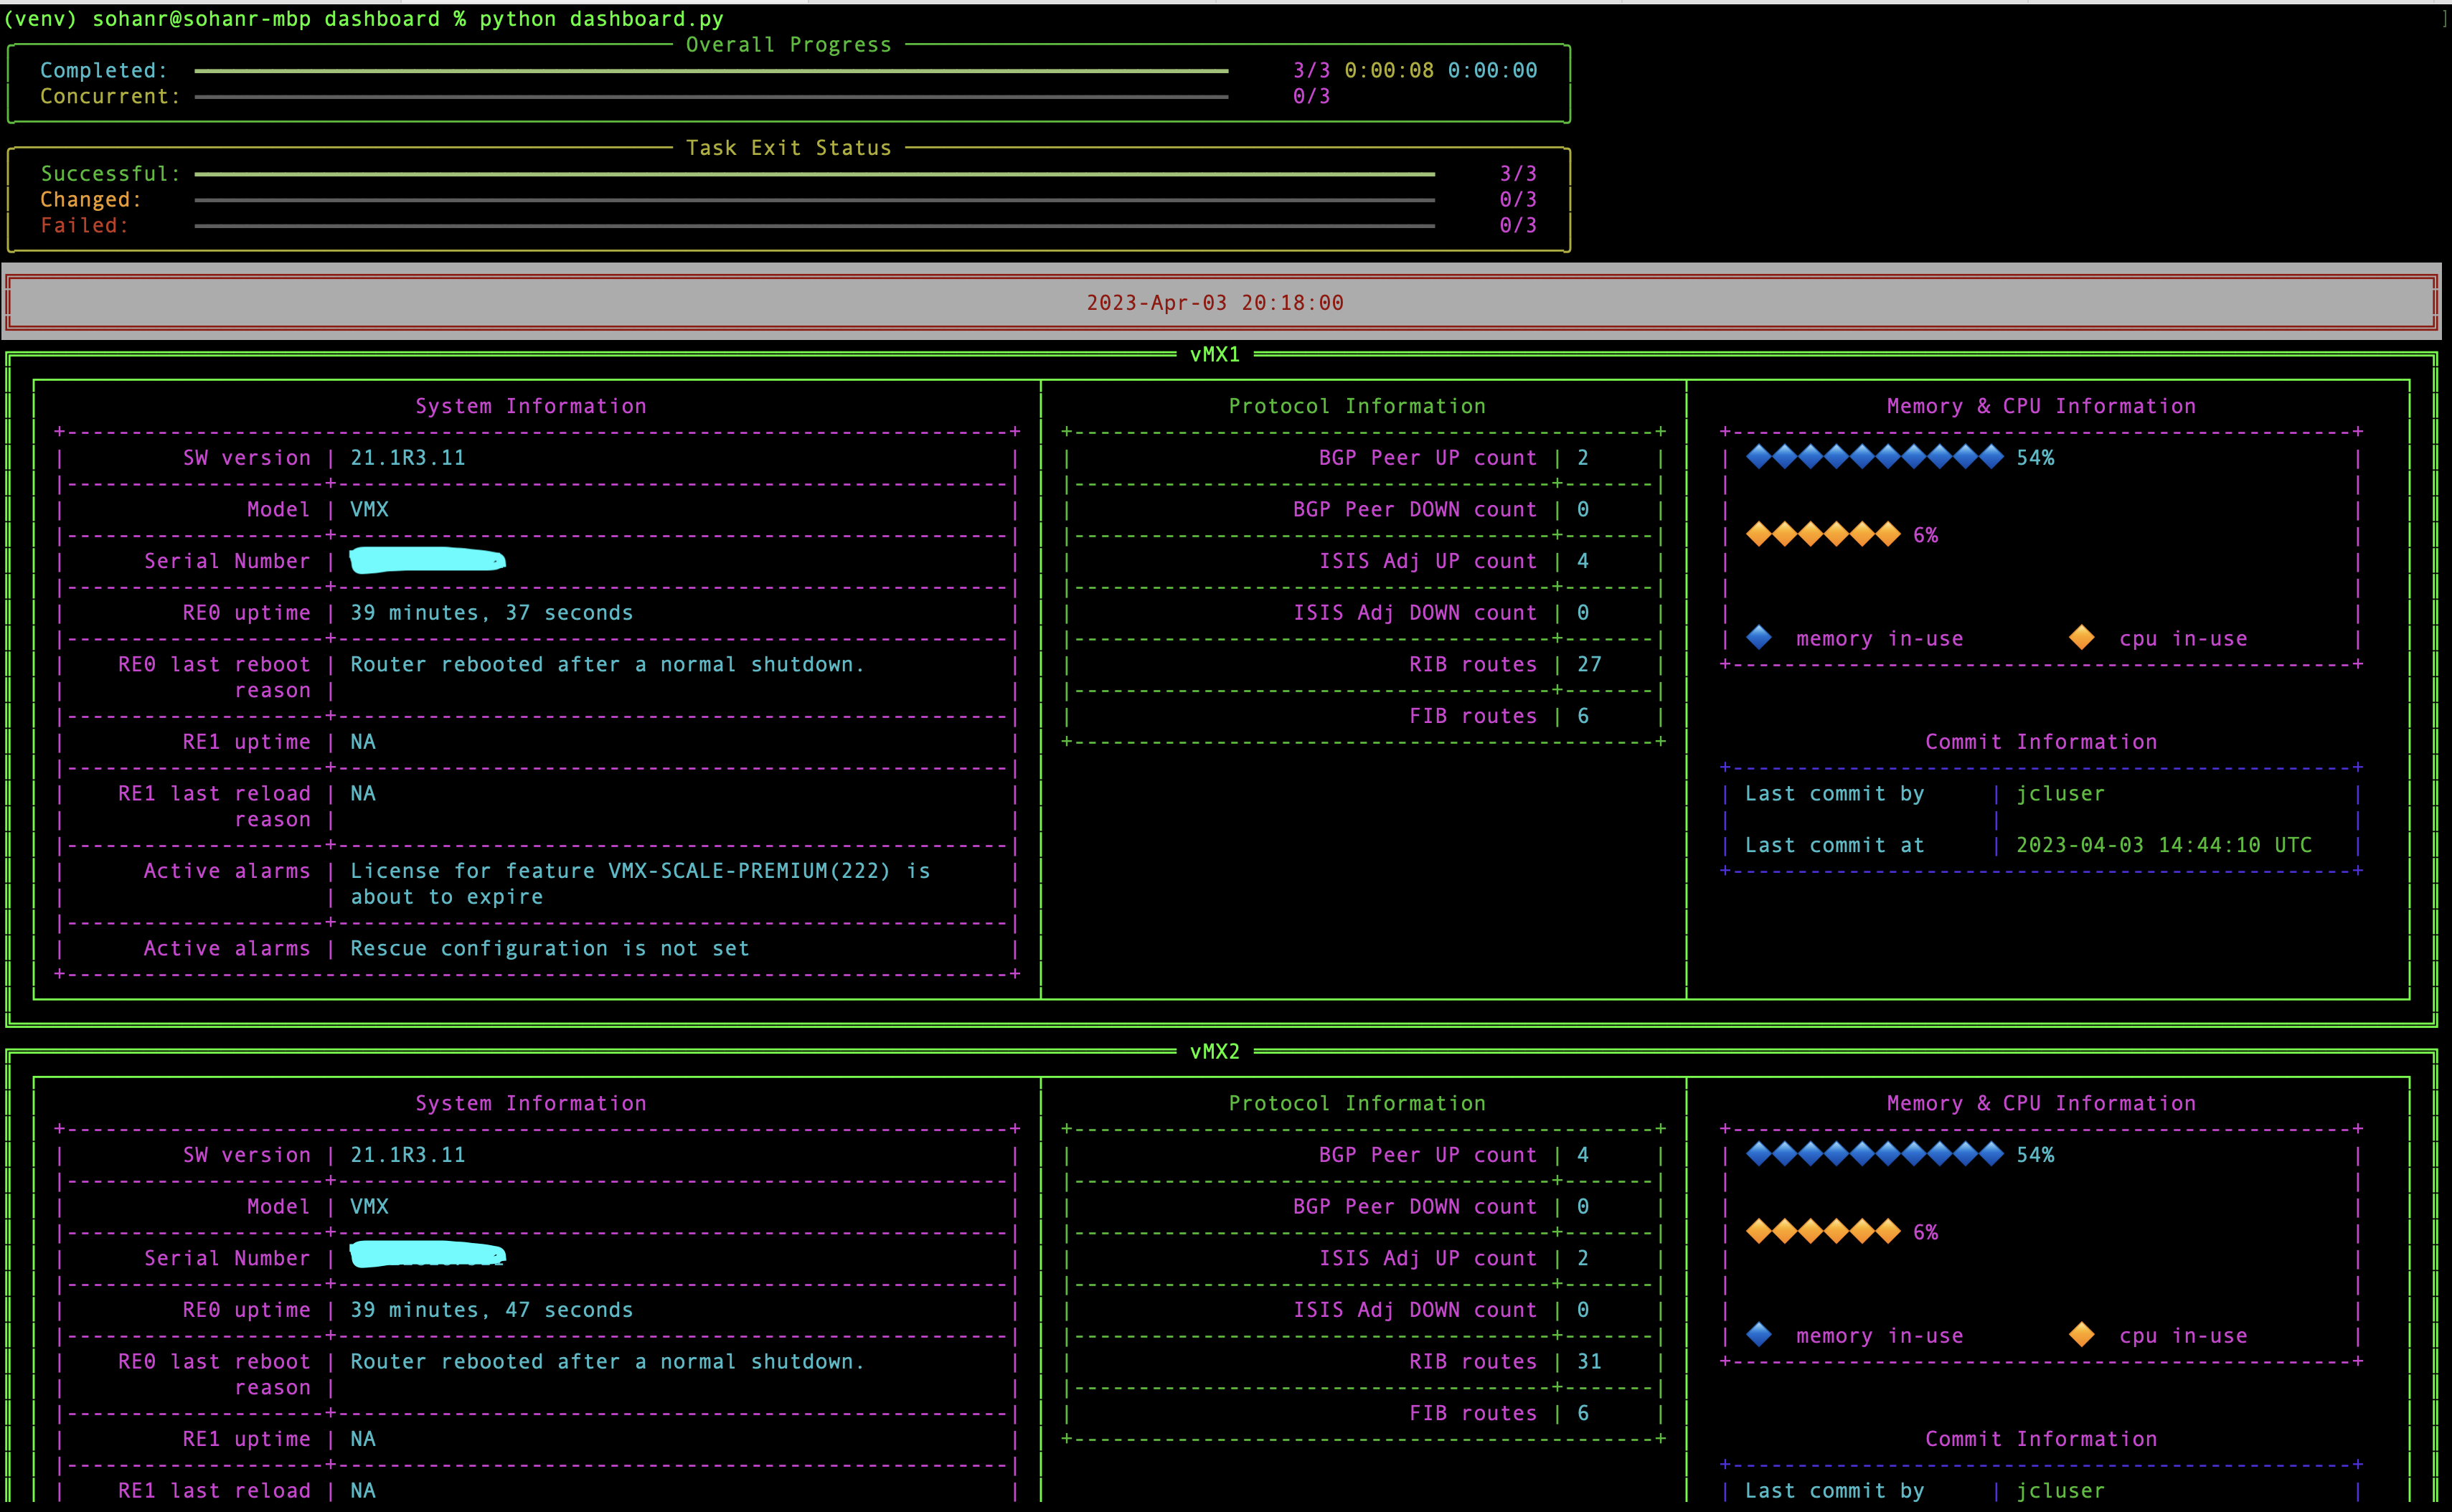
There are two main sections to the script, one is retrieving the necessary data from the routers and two, building the dashboard itself. As mentioned in the beginning of this post, I will be using Junos PyEZ to fetch the network data. PyEZ offers RPCs to fetch network information in structured format which then makes it easy for us to navigate through the data to get the required information. Let’s take a look at one example where we try to fetch the BGP information from the network.
PyEZ RPC in Nornir
In this example, we will be using a task named pyez_rpc in the PyEZ plugin for RPC. For more information on the plugin, please refer to the documentation here.
(venv) sohanr@sohanr-mbp dashboard % python
Python 3.9.6 (default, Sep 26 2022, 11:37:49)
[Clang 14.0.0 (clang-1400.0.29.202)] on darwin
Type "help", "copyright", "credits" or "license" for more information.
>>> from nornir import InitNornir
>>> from nornir_pyez.plugins.tasks import pyez_rpc
>>> nr = InitNornir()
>>> output = nr.run(task=pyez_rpc, func='get-bgp-summary-information')
>>> output
AggregatedResult (pyez_rpc): {'vMX1': MultiResult: [Result: "pyez_rpc"], 'vMX2': MultiResult: [Result: "pyez_rpc"], 'vMX3': MultiResult: [Result: "pyez_rpc"]}
>>>
Nornir returns the result as an Aggregated Result object, which is a dict-like object we can iterate over to get the required information. Let’s say I want to look into one of the host’s data, I can do that as shown below.
>>> output
AggregatedResult (pyez_rpc): {'vMX1': MultiResult: [Result: "pyez_rpc"], 'vMX2': MultiResult: [Result: "pyez_rpc"], 'vMX3': MultiResult: [Result: "pyez_rpc"]}
>>> bgp_data = output['vMX1'][0].result
>>> bgp_data
{'bgp-information': {'bgp-thread-mode': 'BGP I/O', 'thread-state': None, 'default-ebgp-advertise-mode': 'accept', 'default-ebgp-receive-mode': 'accept', 'group-count': '1', 'peer-count': '2', 'down-peer-count': '0', 'bgp-rib': {'@style': 'brief', 'name': 'inet.0', 'total-prefix-count': '0', 'received-prefix-count': '0', 'accepted-prefix-count': '0', 'active-prefix-count': '0', 'suppressed-prefix-count': '0', 'history-prefix-count': '0', 'damped-prefix-count': '0', 'total-external-prefix-count': '0', 'active-external-prefix-count': '0', 'accepted-external-prefix-count': '0', 'suppressed-external-prefix-count': '0', 'total-internal-prefix-count': '0', 'active-internal-prefix-count': '0', 'accepted-internal-prefix-count': '0', 'suppressed-internal-prefix-count': '0', 'pending-prefix-count': '0', 'bgp-rib-state': 'BGP restart is complete'}, 'bgp-peer': [{'@style': 'terse', '@heading': 'Peer                     AS      InPkt     OutPkt    OutQ   Flaps Last Up/Dwn State|#Active/Received/Accepted/Damped...', 'peer-address': '10.100.100.2', 'peer-as': '64522', 'input-messages': '149', 'output-messages': '149', 'route-queue-count': '0', 'flap-count': '0', 'elapsed-time': {'@seconds': '4024', '#text': '1:07:04'}, 'peer-state': {'@format': 'Establ', '#text': 'Established'}, 'bgp-rib': {'@style': 'terse', 'name': 'inet.0', 'active-prefix-count': '0', 'received-prefix-count': '0', 'accepted-prefix-count': '0', 'suppressed-prefix-count': '0'}}, {'@style': 'terse', 'peer-address': '10.100.100.3', 'peer-as': '64522', 'input-messages': '150', 'output-messages': '150', 'route-queue-count': '0', 'flap-count': '0', 'elapsed-time': {'@seconds': '4024', '#text': '1:07:04'}, 'peer-state': {'@format': 'Establ', '#text': 'Established'}, 'bgp-rib': {'@style': 'terse', 'name': 'inet.0', 'active-prefix-count': '0', 'received-prefix-count': '0', 'accepted-prefix-count': '0', 'suppressed-prefix-count': '0'}}]}}
>>>
As you can see, we see a structured data being returned from the device and now we can navigate through it like we do with any dict-like object in python to get the desired information.
>>> total_peers = bgp_data['bgp-information']['peer-count']
>>> down_peers = bgp_data['bgp-information']['down-peer-count']
>>>
>>> total_peers
'2'
>>>
>>> down_peers
'0'
>>>
Hopefully with this as a reference, you should be able to work your way through rest of the data retrieval code.
Building Dashboard using Rich
The easiest part in the dashboard is the Progress Bars we see at the top.
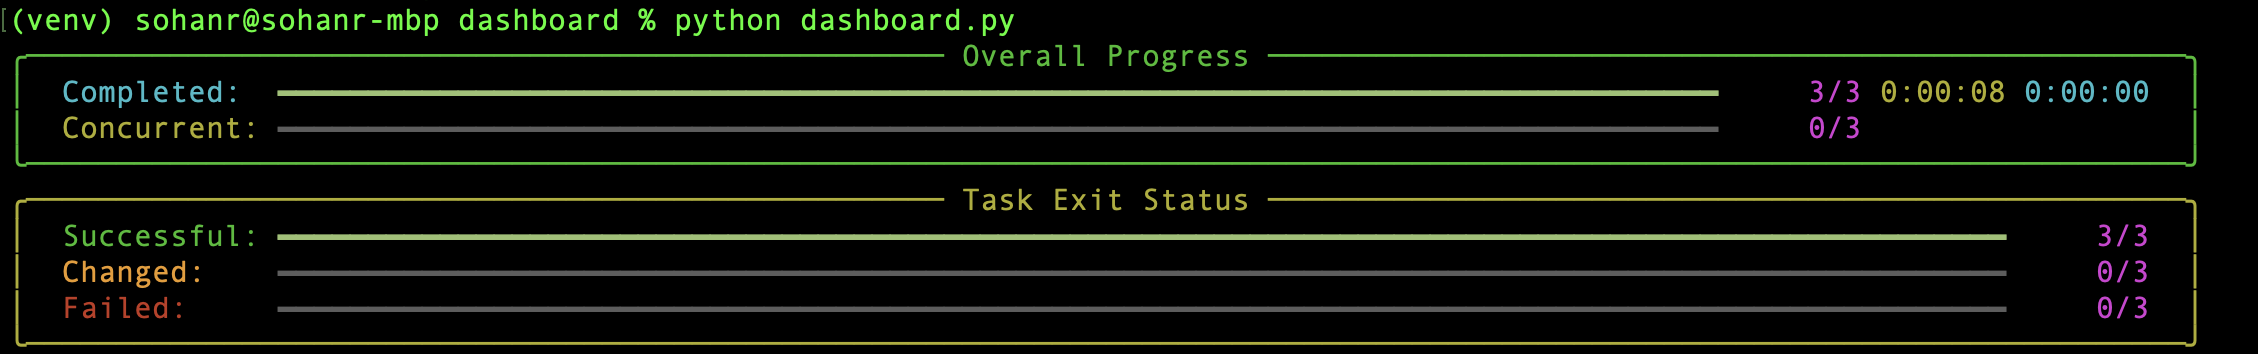
I’m using another Nornir Plugin to do this, called Nornir_Rich. It’s very simple and straight forward to use but the results are really amazing! It is quite literally the best of two worlds, Rich and Nornir!
Next, I’m using Tables to display the information gathered from the device. Let’s take an example of System Information table.
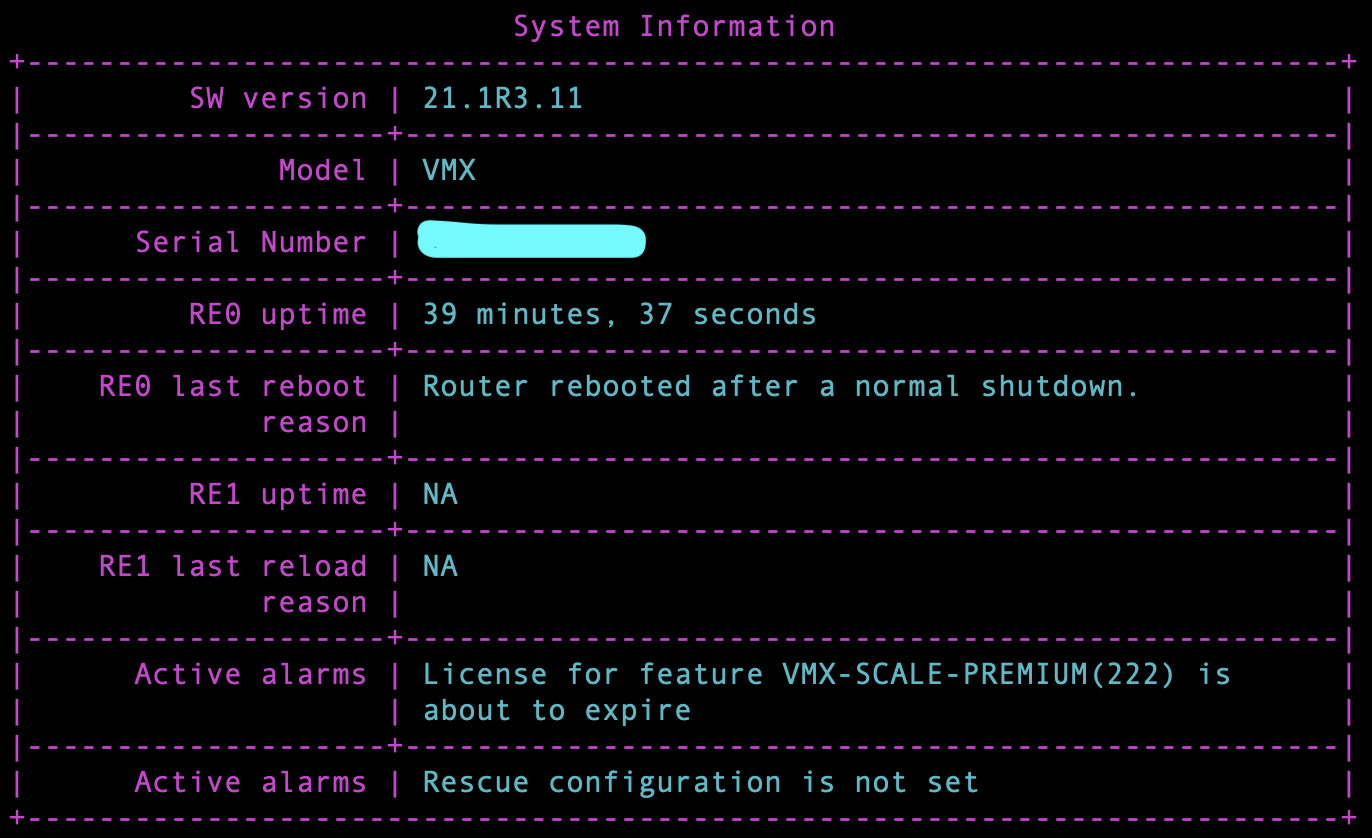
sys_info_table = Table(show_lines=True, show_header=False, box=box.ASCII, title='System Information')
sys_info_table.add_column("Field", justify="right", style="magenta", width=18)
sys_info_table.add_column("Details", style="cyan", width=50)
sys_info_table.add_row('SW version', version)
sys_info_table.add_row('Model', model)
sys_info_table.add_row('Serial Number', serial_num)
sys_info_table.add_row('RE0 uptime', re0_uptime)
sys_info_table.add_row('RE0 last reboot reason', re0_last_reboot_reason)
sys_info_table.add_row('RE1 uptime', re1_uptime)
sys_info_table.add_row('RE1 last reload reason', re1_last_reboot_reason)
Variables like version, model, etc are obtained by navigating through the AggregatedResult object, as explained earlier.
In the dashboard, Memory & CPU Information information is depicted in a rather interesting format. Underneath, it is still a Table but I’m using Emojis to represent the values, this is how the code looks like.
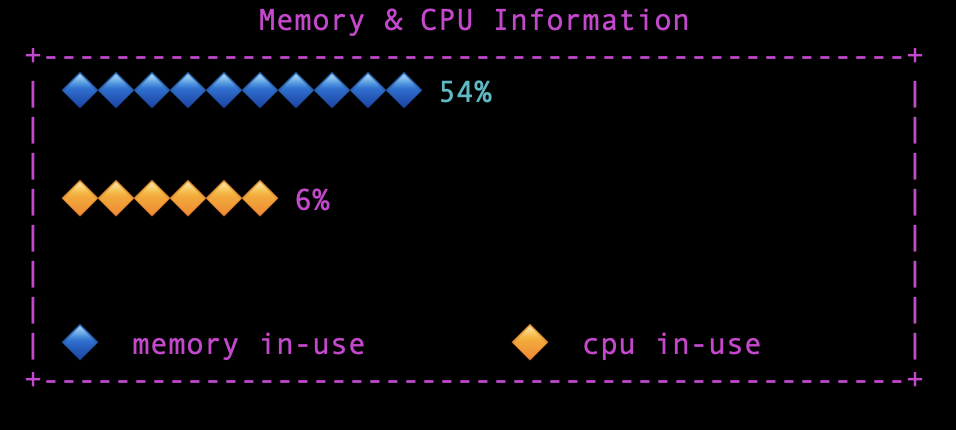
mem_cpu_table = Table(show_header=False, box=box.ASCII, width=50, title='Memory & CPU Information')
mem_cpu_table.add_column("Field", justify="left", style="magenta")
if used_mem > 20: # To reduce the number of emojis/diamonds displayed
    mem_cpu_table.add_row(":large_blue_diamond:" * (int(int(used_mem)/5)) + f" {used_mem}%" + "\n\n", style='cyan')
else:
    mem_cpu_table.add_row(":large_blue_diamond:" * int(used_mem) + f" {used_mem}%" + "\n\n",
                            style='cyan')
if int(cpu_usage) > 20:
    mem_cpu_table.add_row(":large_orange_diamond:" * (int(int(cpu_usage)/2)) + f" {cpu_usage}%" + "\n\n\n",
                            style='magenta')
else:
    mem_cpu_table.add_row(":large_orange_diamond:" * int(int(cpu_usage)) + f" {cpu_usage}%" + "\n\n\n", style='magenta')
mem_cpu_table.add_row(":large_blue_diamond:  memory in-use\t:large_orange_diamond:  cpu in-use")
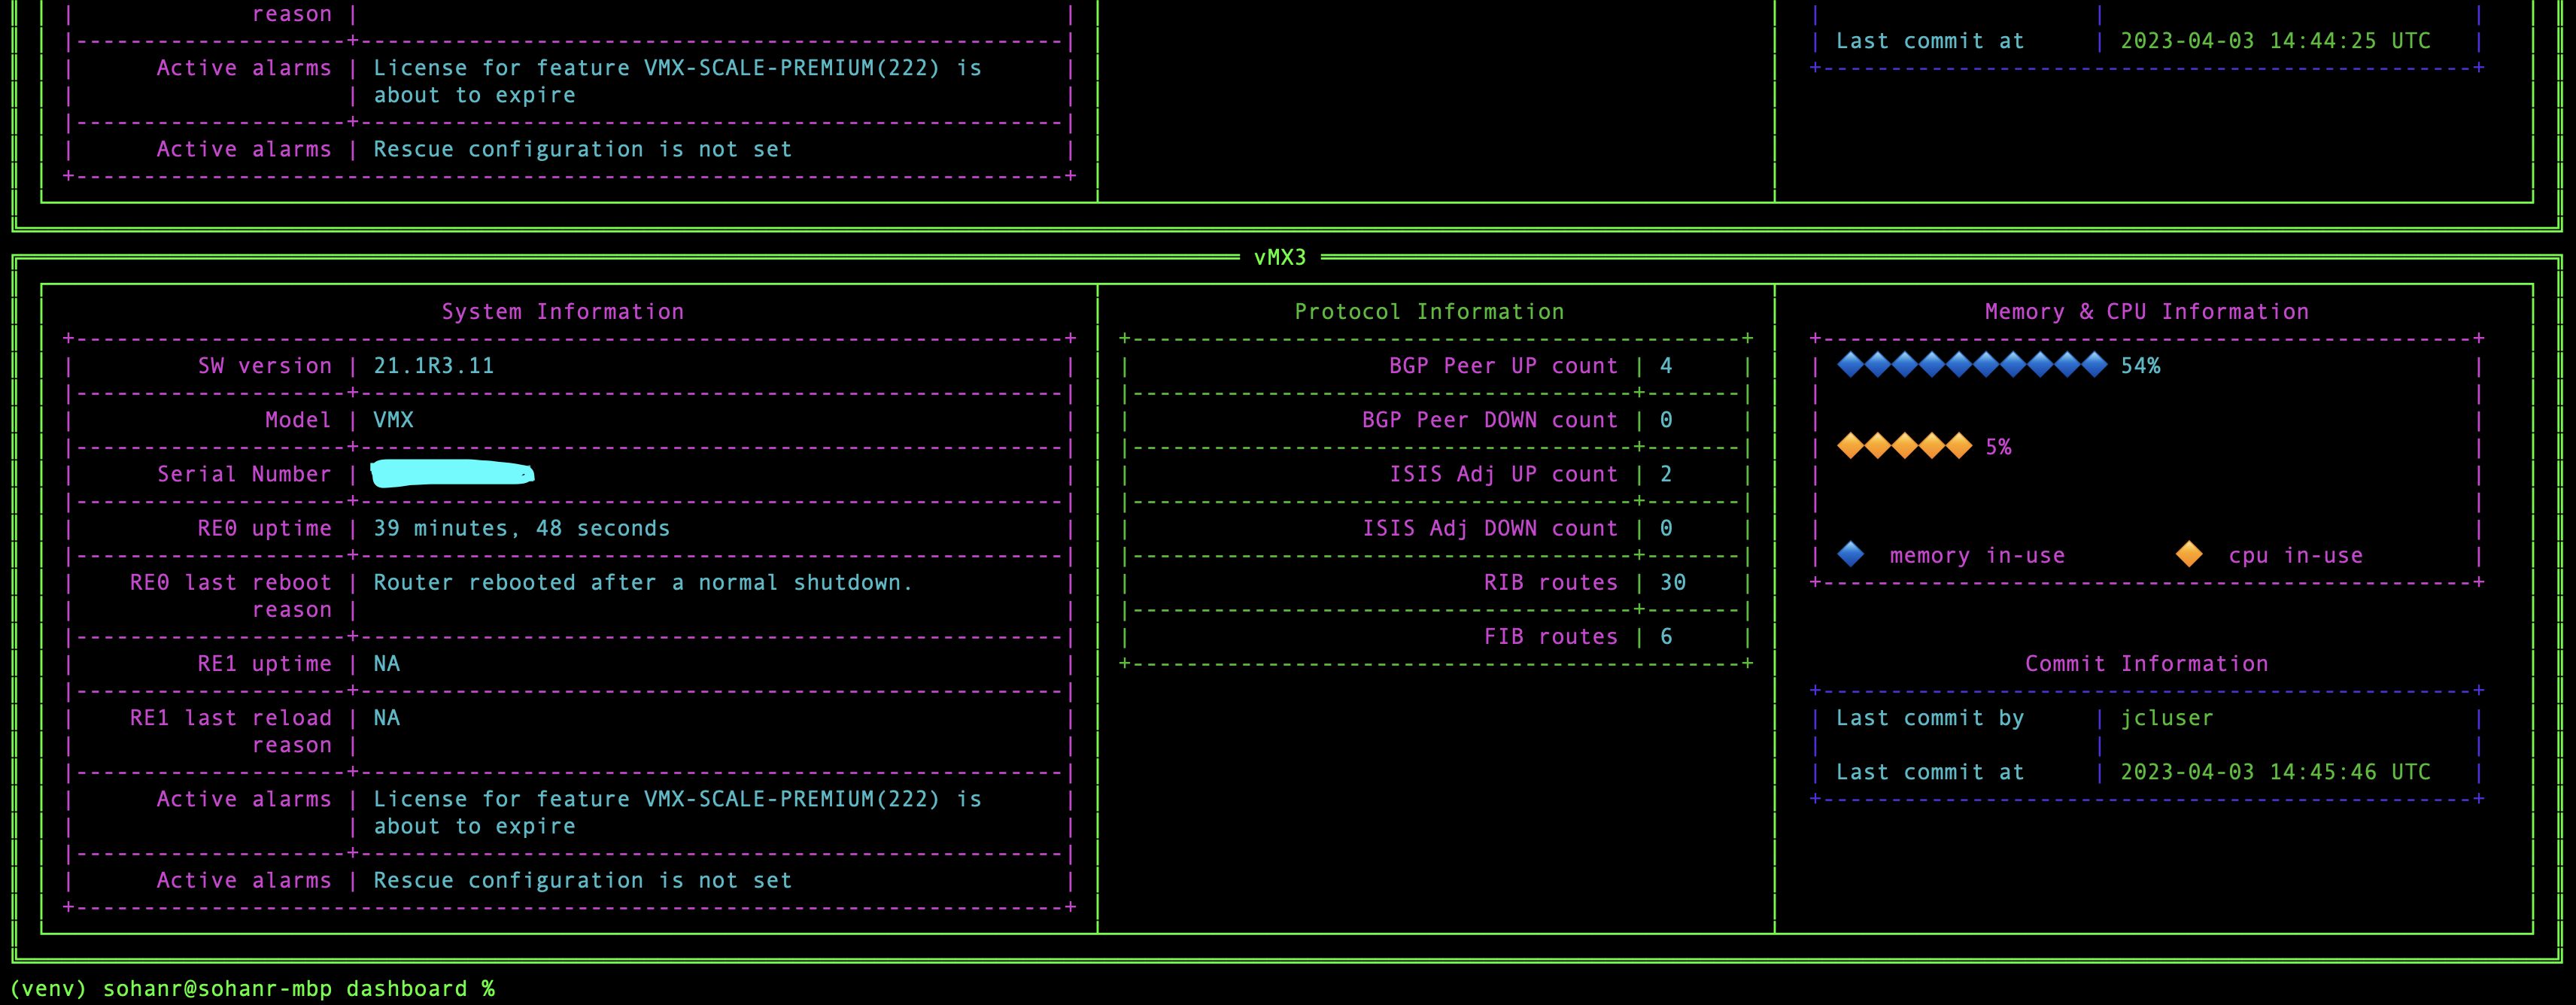
Once I have the 3 tables in place, I put them together in one single table. Note that Memory & CPU Information & Commit Information were merged together to form a single mem_cpu_commit_table table
# Everything comes together, all the tables are put into one main table, which is then rendered in a Panel
main_table = Table(show_lines=True, show_header=False)
main_table.add_column(justify="right", style="magenta")
main_table.add_column(justify="right", style="green")
main_table.add_column(justify="right", style="magenta")
main_table.add_row(sys_info_table, protocols_table, mem_cpu_commit_table)
Next, we make use of Panels to place our final table. We repeat the same procedure for all the hosts in our inventory and keep appending the panels of each host into a list named panel_list.
panel = Panel(main_table, width=200,title=router, box=box.DOUBLE)
panel_list.append(panel)
Finally, we iterate over the panel_list and print the panels into the console using console.print. I would also like to highlight another element in the dashboard that appears when the script is building the dashboard (unfortunately the snapshot of the dashboard doesn’t show it) i.e., Spinner. Spinners are nice when you want to display an animation when the script is executing a piece of code and awaiting completion.
I know that I skimmed over a lot of details but hopefully by going through one example of each of the elements used in the script, I’ve given a basic idea of the logic and technique used to construct the dashboard. Please refer to the full code here and if you have not used Rich yet, hopefully this is a starter for you to go on and explore more! While I’ve been working on this, folks from Rich have released another mind blowing library called Textual which takes working in the terminal to a whole another level! May be soon I will give that a go and post it here, until then goodbye!